While writing a different blog post, I began running performance tests on my recently released side project, surtoget.no. Although it doesn't receive an overwhelming number of visitors, its performance has been excellent, so I was curious about its actual performance nonetheless. This entire thing turned into a rabbit hole, which got a little out of control and eventually became its own thing.
Oops.
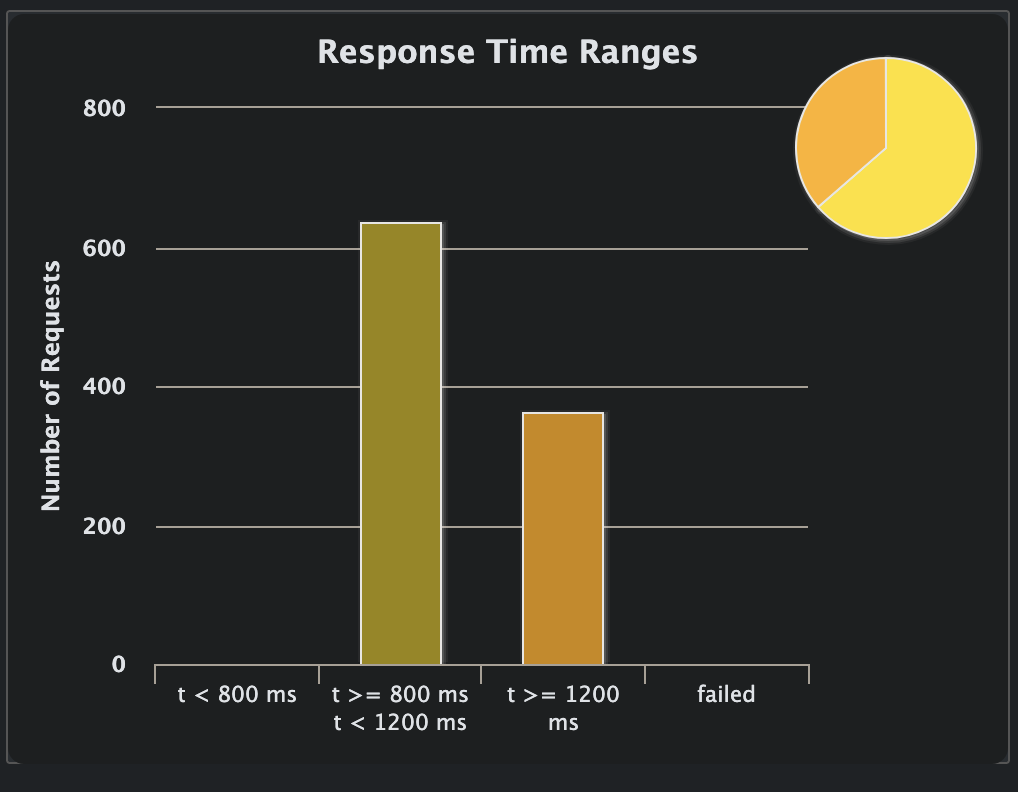
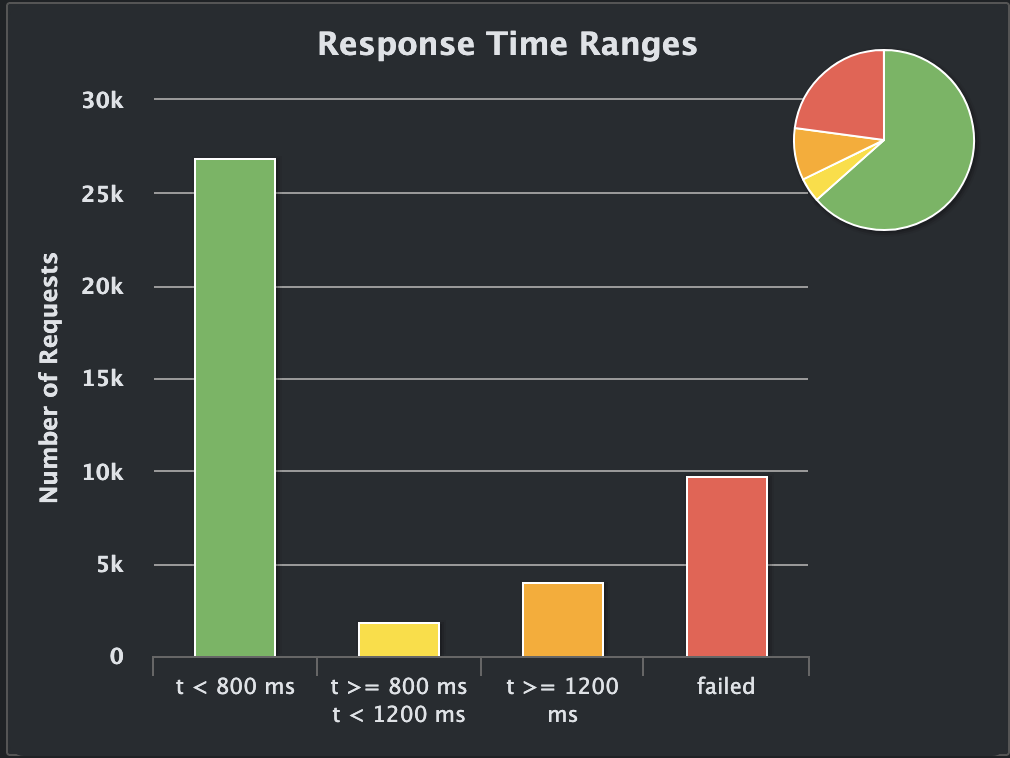
The story starts with me wanting to see how much load the website could take, given a pseudo-similar setup to production. Here's me running Gatling against a container limited to a single CPU core and 512MB of memory on my Mac Pro M2, with a thousand concurrent users:
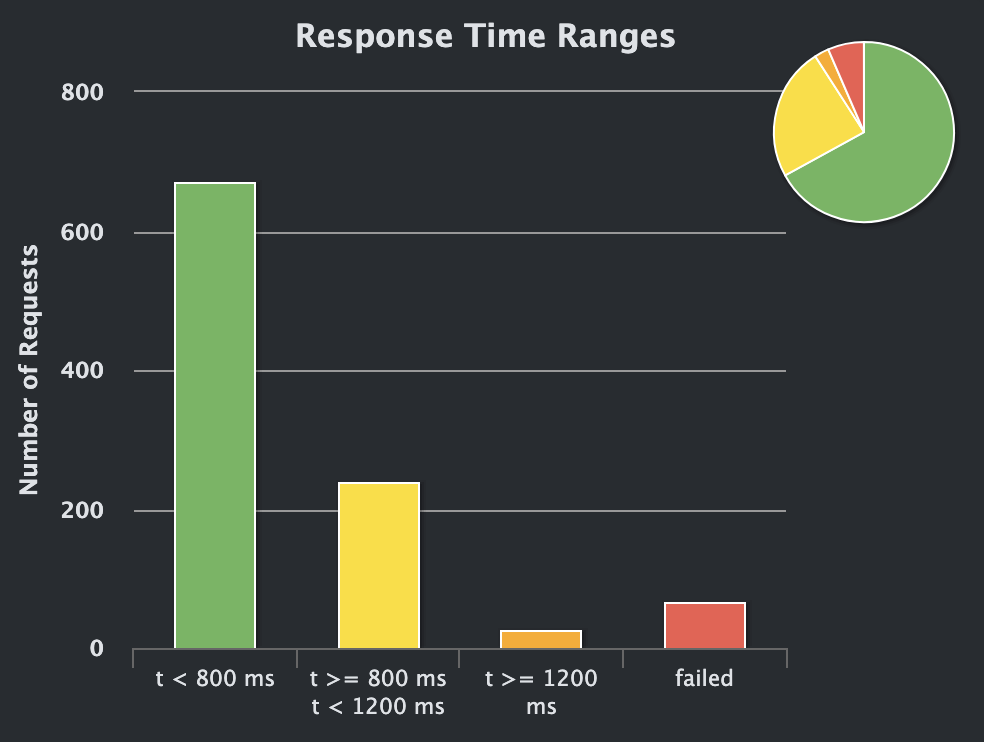
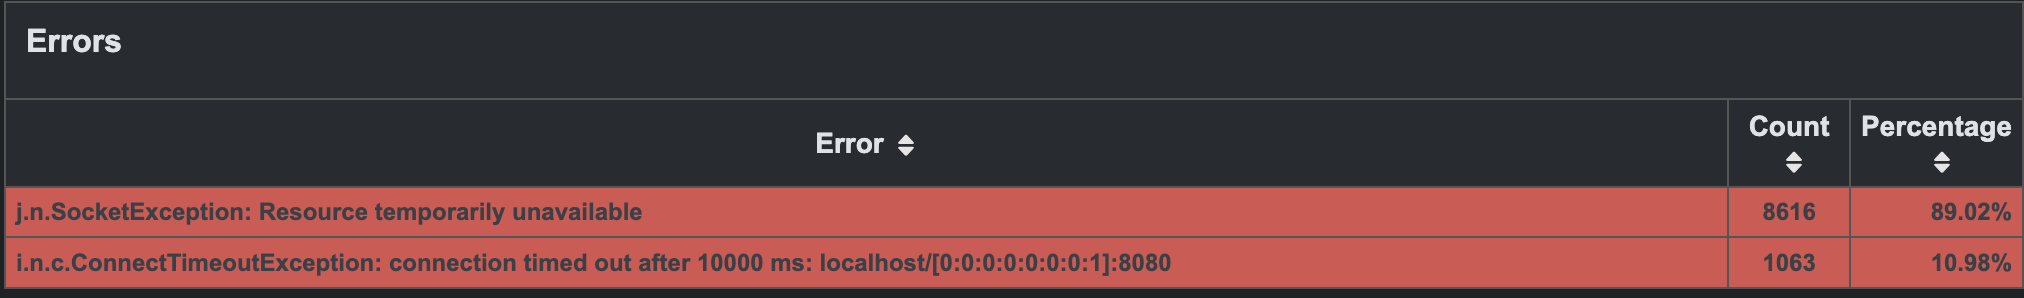
This isn't what I expected. I had hoped for much better. Also, it seems like there are failed requests:
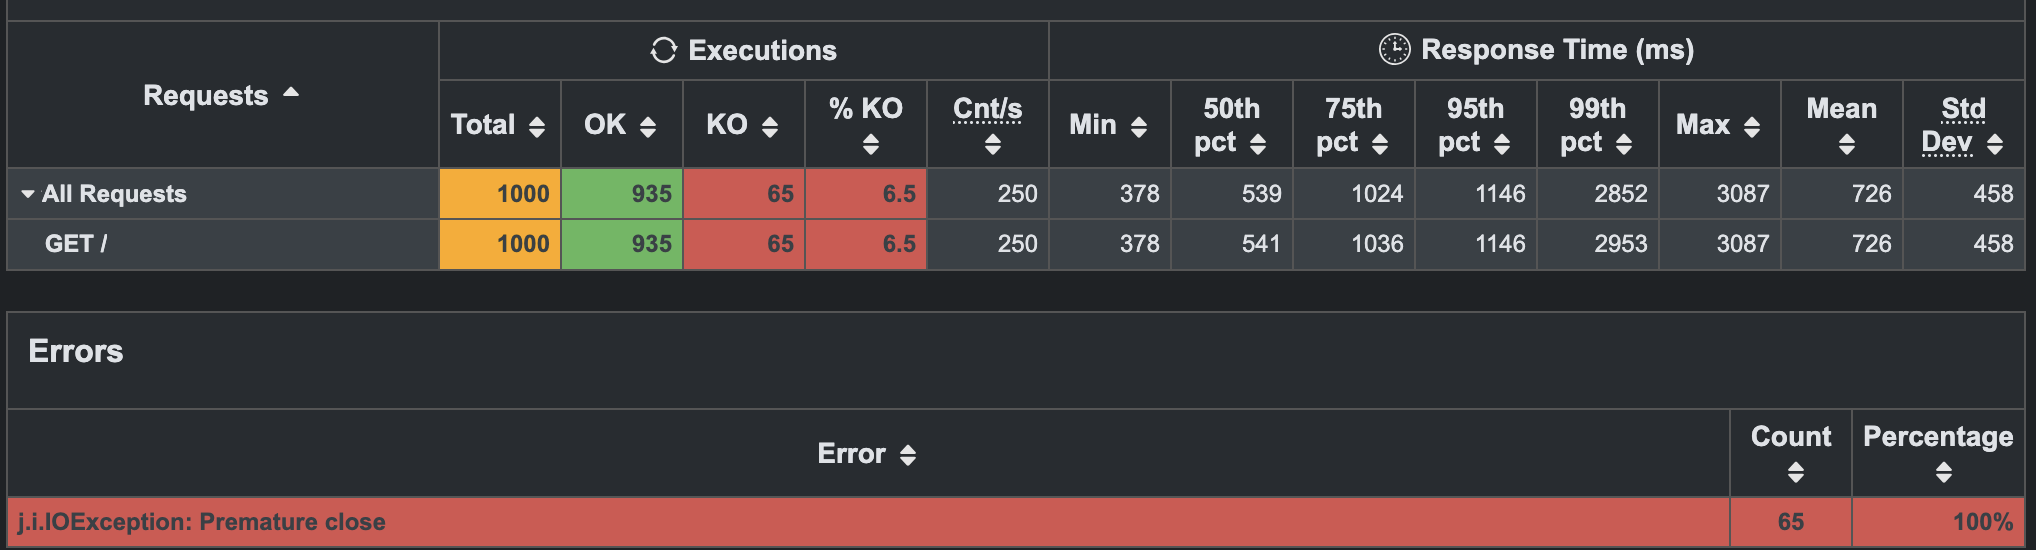
This is not what I had hoped for - I wanted this to be a fun and happy tale about Gleam's performance!
The website, which is open-source, is pretty basic for the most part. There's little to no I/O happening, and I was confused where the bottleneck was. That was until I remembered some issues I had during the development of Surtoget. For context, there's a feature within Surtoget that allows us to display whether a train is delayed on Sørlandsbanen. We achieve this by reaching out to Entur's real-time API and fetching the necessary data. Entur returns a chunky XML file. I wanted to cache the processed result so that each caller wouldn't have to wait for it to be processed (and there's a limit of 4 requests per minute).
To implement this cache I used Gleam's actors with a basic type, like so:
pub type State {
  State(has_delay: Bool)
}

pub type DelayMessage {
  RefreshState(State)
  GetState(process.Subject(Bool))
}

fn handle_message(state: State, message: DelayMessage) {
  case message {
    RefreshState(state) -> {
        // Call Entur API
        // Process results
        actor.continue(new_state)
    }
    GetState(reply_to) -> {
      process.send(reply_to, state.has_delay)
      actor.continue(state)
    }
  }
}
This seems all well and good, but something I quickly discovered is that only one message is processed at a time (which is something I deep down already knew):
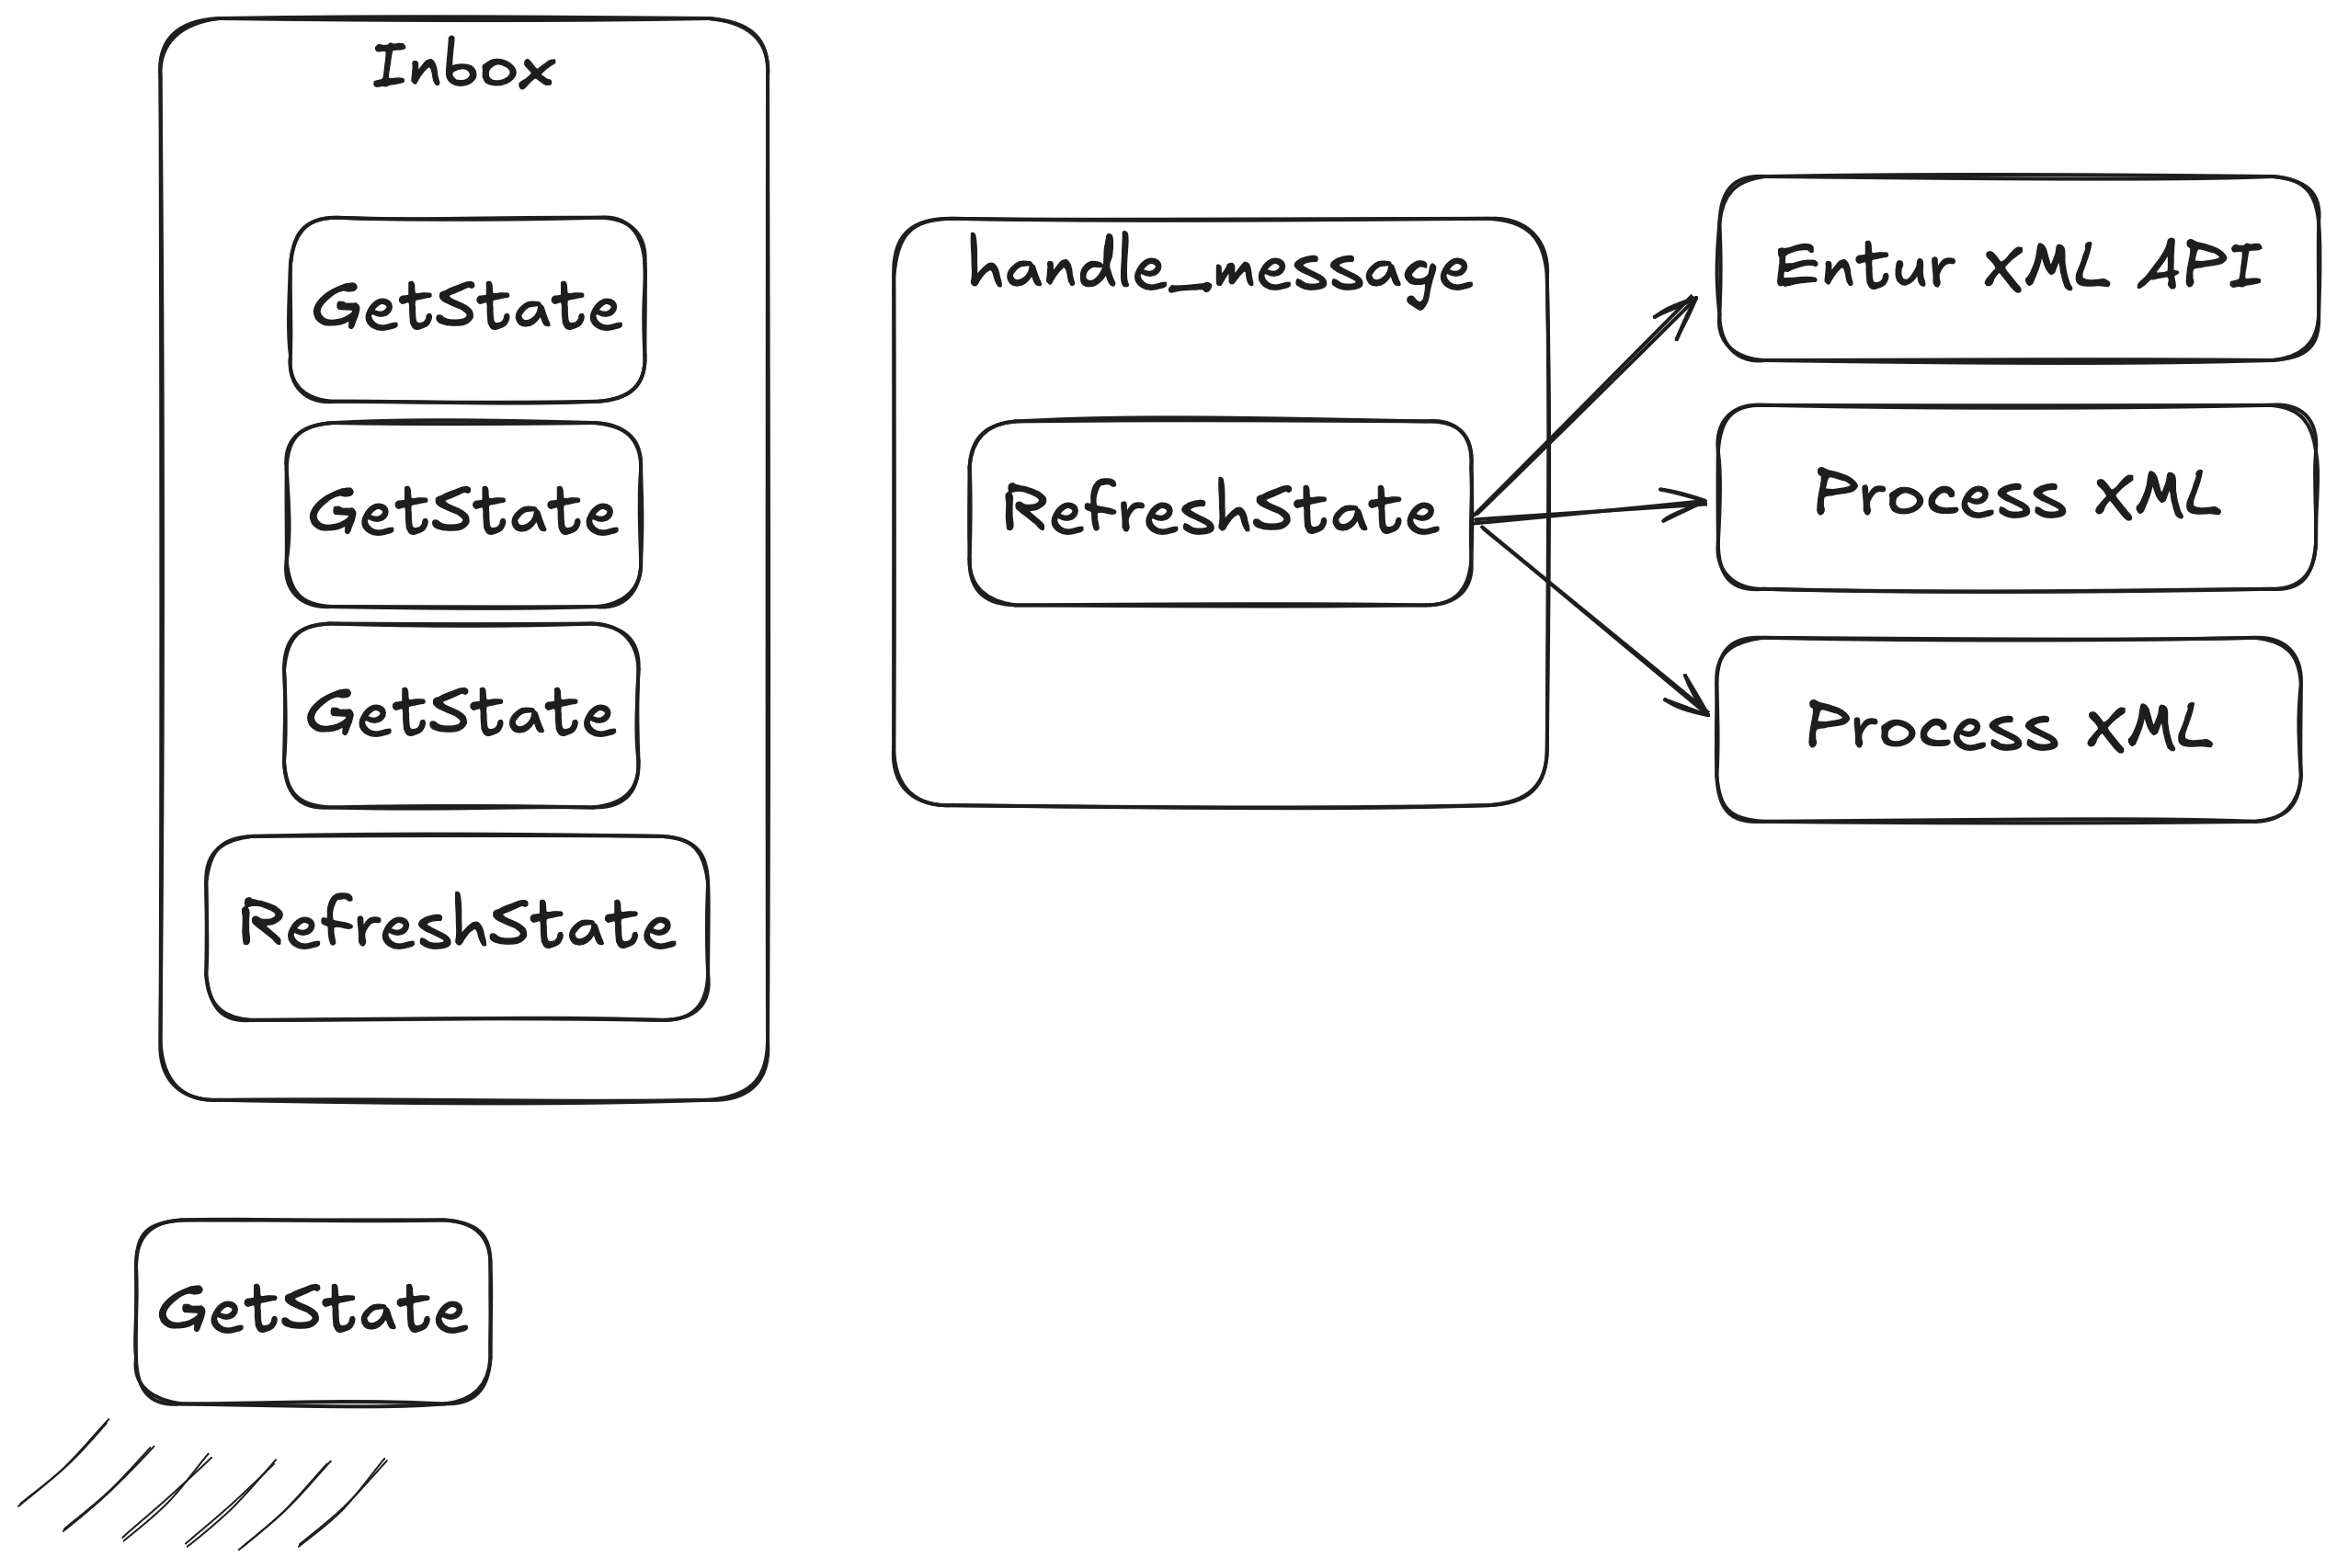 Even worse, all the
 GetState messages had a timeout of 100ms, which quickly caused issues as messages started failing.
The solution, at the time, was to move the actual processing to a supporting process that ran in the background, and create a SetState message instead:
pub type State {
  State(has_delay: Bool)
}

pub type DelayMessage {
  SetState(State)
  GetState(process.Subject(Bool))
}

fn handle_message(state: State, message: DelayMessage) {
  case message {
    SetState(state) -> actor.continue(state)
    GetState(reply_to) -> {
      process.send(reply_to, state.has_delay)
      actor.continue(state)
    }
  }
}
This solved the initial problem because simply setting the state was much faster, so other GetState messages never got stuck in the inbox long enough to be timed out. This solution seemed to solve the problem at the time. After all, I didn't expect that many users (and to be frank, I still don't). I therefore deemed it to be "performant enough".
The thing about actors in Gleam (and Beam in general) is that they're great for controlling concurrency, such as preventing race conditions and managing complexity within a distributed system. However, they're not ideal for use cases that demand extremely fast, concurrent reads, such as caches, because each actor processes messages sequentially, which can become a bottleneck under heavy load (which happened here).
The reason is that even if my service can handle N requests simultaneously, the cache can only be accessed by one user at a time, which means it can become a bottleneck when I throw a bunch of requests at it with Gatling.
I was reminded of this when I saw this post from the man himself in Gleam's discord:
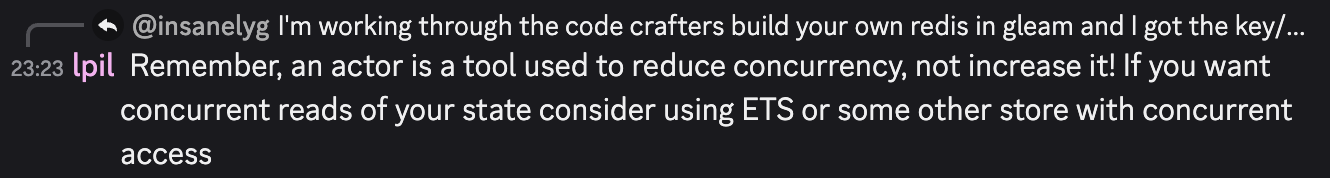
While the message wasn't for me, it pointed me in the right direction: Erlang's ETS table!
Note
When I first discovered the ETS table, I got pretty excited, but for whatever reason, it seems that all the Gleam libraries for ETS are outdated. That's why I'm rolling my own implementation here.
First, I had to write my Erlang FFI wrapper:
-module(ets_cache).
-export([new/1, insert/3, lookup/2]).

new(Name) ->
    try
        {ok, ets:new(Name, [set, public, named_table, {read_concurrency, true}])}
    catch
        _:badarg ->
            % This error can happen if the table name is not an atom,
            % or if the table already exists. We check for the latter.
            case ets:whereis(Name) of
                undefined ->
                    % Table does not exist, so it must be a different badarg error.
                    {error, {erlang_error, atom_to_binary(badarg, utf8)}};
                _ ->
                    % Table already exists, which is fine for our use case.
                    {ok, Name}
            end;
        _:Reason ->
            {error, {erlang_error, atom_to_binary(Reason, utf8)}}
    end.

insert(Tid, Key, Value) ->
    try
        ets:insert(Tid, {Key, Value})
    of
        _ -> {ok, nil}
    catch
        _:Reason -> {error, {erlang_error, term_to_binary(Reason)}}
    end.

lookup(Tid, Key) ->
    try
        ets:lookup(Tid, Key)
    of
        [{_, Value}] -> {ok, Value};
        [] -> {error, empty}
    catch
        _:Reason -> {error, {erlang_error, term_to_binary(Reason)}}
    end.
It is pretty rough, but it gets the job done. And I can create some external functions in Gleam like this:
@external(erlang, "ets_cache", "new")
pub fn new_cache(name: atom.Atom) -> Result(atom.Atom, atom.Atom)

@external(erlang, "ets_cache", "insert")
pub fn insert(
  tid: atom.Atom,
  key: atom.Atom,
  value: Bool,
) -> Result(Nil, atom.Atom)

@external(erlang, "ets_cache", "lookup")
pub fn lookup(tid: atom.Atom, key: atom.Atom) -> Result(Bool, atom.Atom)
And simply call them like this:
pub fn is_delayed(tid: atom.Atom) -> Bool {
  case lookup(tid, atom.create("has_delays")) {
    Ok(value) -> value
    Error(_) -> False
  }
}
The result of this change was this:
While the overall site is slower under heavy load, it also avoids errors. I'd rather want users to be served slowly rather than not at all (or thrown out quickly if there's not enough performance, but with an appropriate error message). The site actually manages the load, even though the overall response times aren't anything to write home about.
I increased the number to 1500 concurrent users and ended up with this:
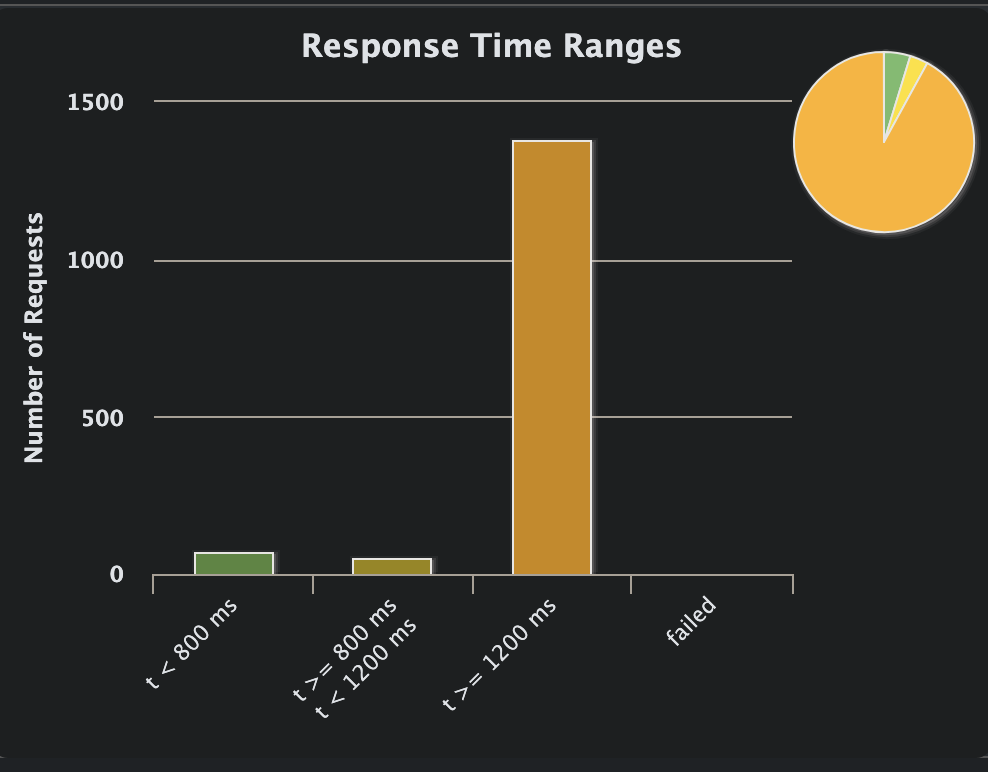
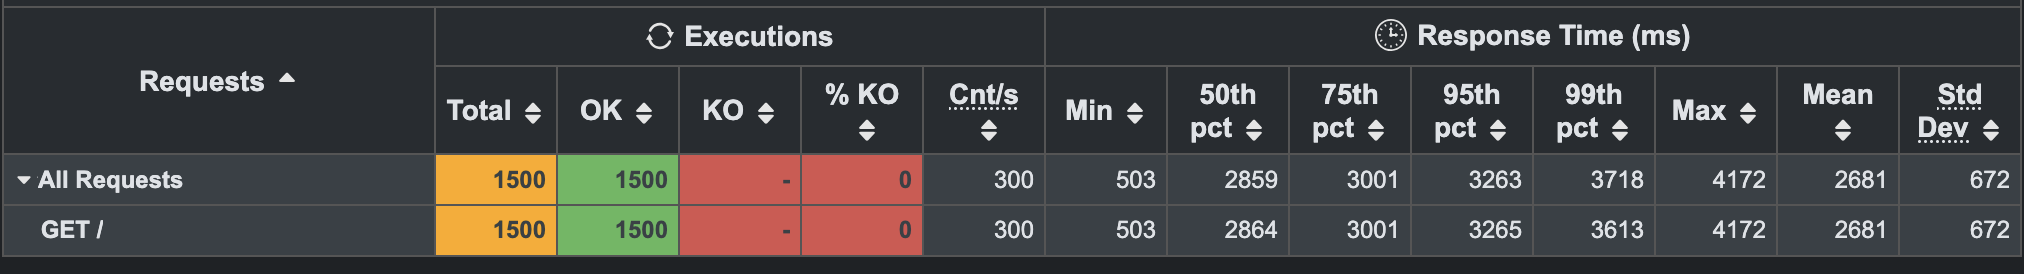
Still not a single error! When I ran the actor version with 1,500 concurrent users, it crashed quickly, and most users encountered errors. We are, however, most likely at the limit. When the above is running, I can see the usage for the container going through the roof:
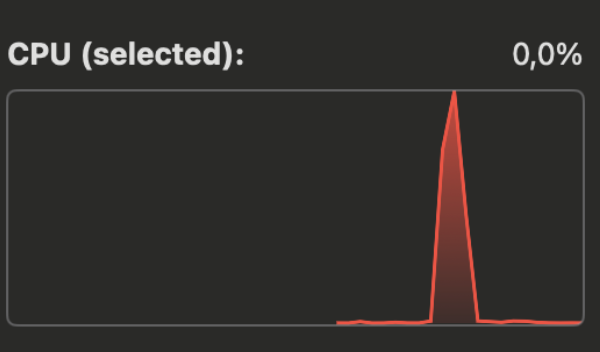
I must remind you, however, that this is a container limited to a single CPU core and 512MB of memory. It might seem like a small number, but taking the constraints we're working with, I'd say it is doing pretty good!
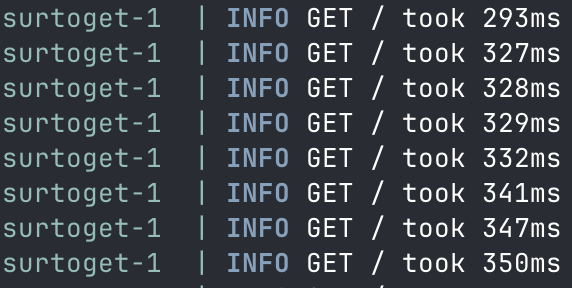
If we go a bit deeper, we can look at the output of my homebrew performance middleware, which is coded into the app, and measures my code. At the high point, we see the code taking up to 350ms to respond:
While at the low end, we see plenty of sub-10ms responses:
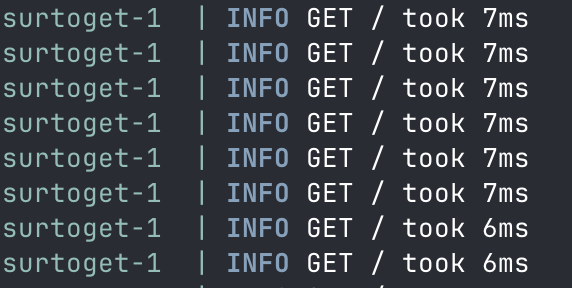
To me, that suggests that there is a bottleneck somewhere and calls are being held up in the network queue, causing further issues down the line.
Let's test the system again, but this time ramp up to 1500 concurrent users over a 30-second window:
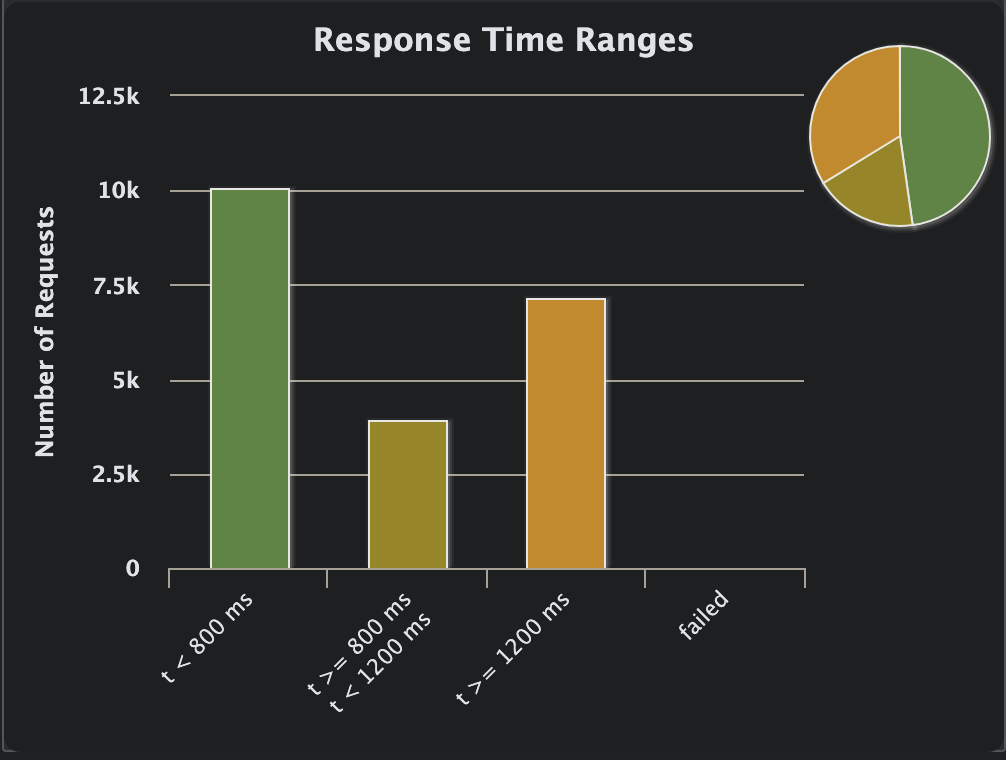
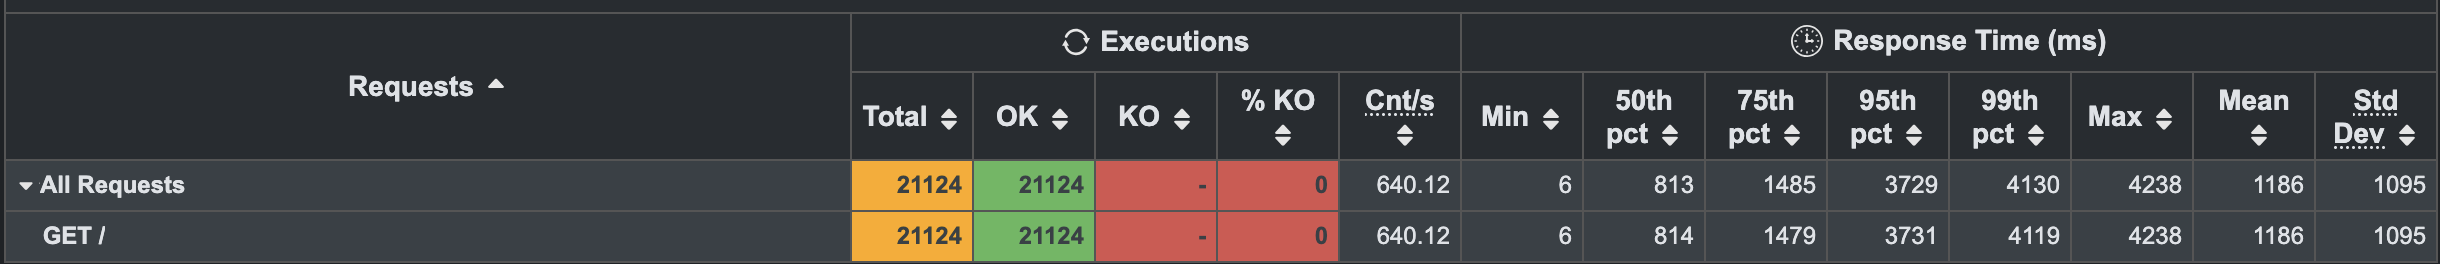
I think it is pretty awesome that the site manages to handle 21,124 requests in 30 seconds, considering its constraints.
I must also admit that this whole exercise is kinda silly, because they're just me playing around with my system on my machine using Docker. It is not a real benchmark. It proves that Gleam can achieve pretty decent results, but the case may be that Gleam has much more potential, while my code is trash. We cannot reliably compare my findings with anything else.
If we increase the concurrent users to 2500, we'll start seeing a memory issue arise, and the service eventually crashes. Surtoget's front page is not entirely static due to a feature that shows whether a train is delayed or not. This means that we're building the page dynamically each time it is requested, which is kept in memory until it is returned as a request.
If we run Gatling against a fully static portion of the site, like the about page, we see something different:
Now we have a lot more failed requests, but the service is healthy and lives, but this time the errors seem to be deliberate as the service tries to protect itself from crashing:
I suspect this is because the service is heavily CPU-bound during this test, having only a single core to play with. To reiterate, I am not a Gleam expert, nor do I know how to optimise every CPU cycle out of Gleam or Beam. There might be an obvious thing that would improve my site tenfold, but these are the results I managed to achieve despite not being an expert.
Note
If any experts notice any errors with the above, please let me know. I'd love to learn!
Sooooo, it turns out that my usage of Gleam's actors was pretty bad. But hey, we live and learn, right?
This also means that I have the same issue for my own website, and my homebrew cache for blog posts and images, which is actor-based, should also be rewamped...
Another improvement I can make is to actually cache the entire front page, rather than just whether a train is delayed or not. That would resolve the memory increase during heavy load and remove a lot of unnecessary processing.
Luckily enough, I don't have traffic anywhere close to this becoming an issue, so there's no immediate problem, but it should be resolved at some point.
If you skipped to the end, here's the lesson: Don't use Gleam OTP for caches. It's the wrong tool for the job. Thanks.